Hard to say at the moment, there’s hardly any load on the server at the moment…
But this is a really low powered, old box - a HP Proliant ML110 G4 (!) - and there’s not much running besides Firewall, Mail, NextCloud and Zabbix.
Finally i have tested your solution which has been described here by @mrmarkuz and @syntaxerrormmm - and I must say that i haven’t seen better Zabbix Howto that this - great job all of you - finally i can monitor my network/server environment !
I was wondering if the developer team could make it possible to have Zabbix as a module in NS ?
sorry for the late reply … i’ve installed last week as test-in-production and for now it’s all ok (only linux server monitoring ) but i still need to reconfigure lot of things…
anyway no error during install and i appreciate the postgresql choiche…
great work tnx i’ll keep you informed
I’m so intrigued by this that I’ve got this running on 4 servers. All 4 are running excellently so far - no hiccups!
Quite a few of my clients run a small environment, some at home, some even in the small office. Quite common is a HP Microserver Gen8 with 16 GB RAM and virtualisation (Now all ProxMox). There’s hardly enough RAM to run a NethServer and a Windows (Terminal/RDP) Server side by side - let alone a Stand-Alone monitoring system (Zabbix).
Then again, a few clients who have NethServer running on an older Server hardware, but natively. No virtualisation or possibility of a stand alone monitoring system. This helps in such a scenario, too!
Markus, you must make this a full Module for NethServer, I’ll gladly provide the testing and Symbols.
A bow to the City of Vienna! Keep up your excellent work!
Why not using a Zabbix Proxy in this case? Well, one for each customer I mean. We use a virtualized NethServer with 1/2 vCPU and 2 GB of RAM on each customer’s hypervisor. Alternatively you may deploy a Proxy on a RaspberryPi you then link all the proxies to a single centralized Server. Trust me, Zabbix binaries are really optimized and will work well also on poor hardware.
My clients want in house monitoring. My older Nagios was satisfied with 1-2 GB RAM, Zabbix takes 2-4 or more…
For the Multiple-Sites scenario, I like the idea of using OPNsense as the Firewall, and NethServer as Server On-Site. OPNsense actually comes with an Agent or Proxy (or both) if needed. I have cases where the remote site has basically ONLY a windows cashier-box, sometimes a networked printer, and VPN to the main site.
The client’s OK with buying the OPNsense hardware, I get monitoring thrown in with the VPNs…
You are lucky. Ours don’t, plus I am quite sure they wouldn’t like to pay for monitoring even when you explain to them why they would want to have it in place. Answering to them “We know what’s going on” when they call you on phone with issues is a much sufficient reward in some case.
Sure, as always, YMMV and you are not bound to choices done by other within NS; still, if you are ok with Nagios, why bothering changing monitoring system?
I think Zabbix is far superior to Nagios for a lot of reasons (you may add/remove checks to a host from the web interface; the single frontend console can be set up to show data only for a customer using different usernames to access it; autodiscoverying/autoregistration rules can be set up, so customers only need to install the Agent [if you provide an installer to them] or enable SNMP on a device; it can be extended with small effort if you are ok with writing some scripts and a lot more).
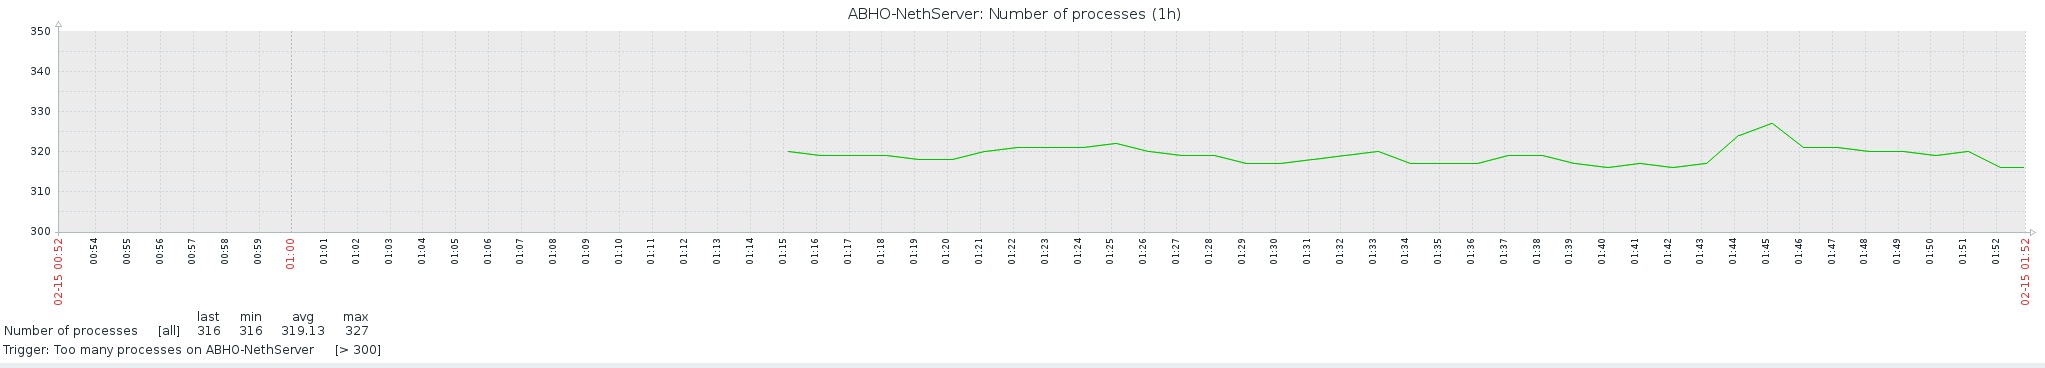
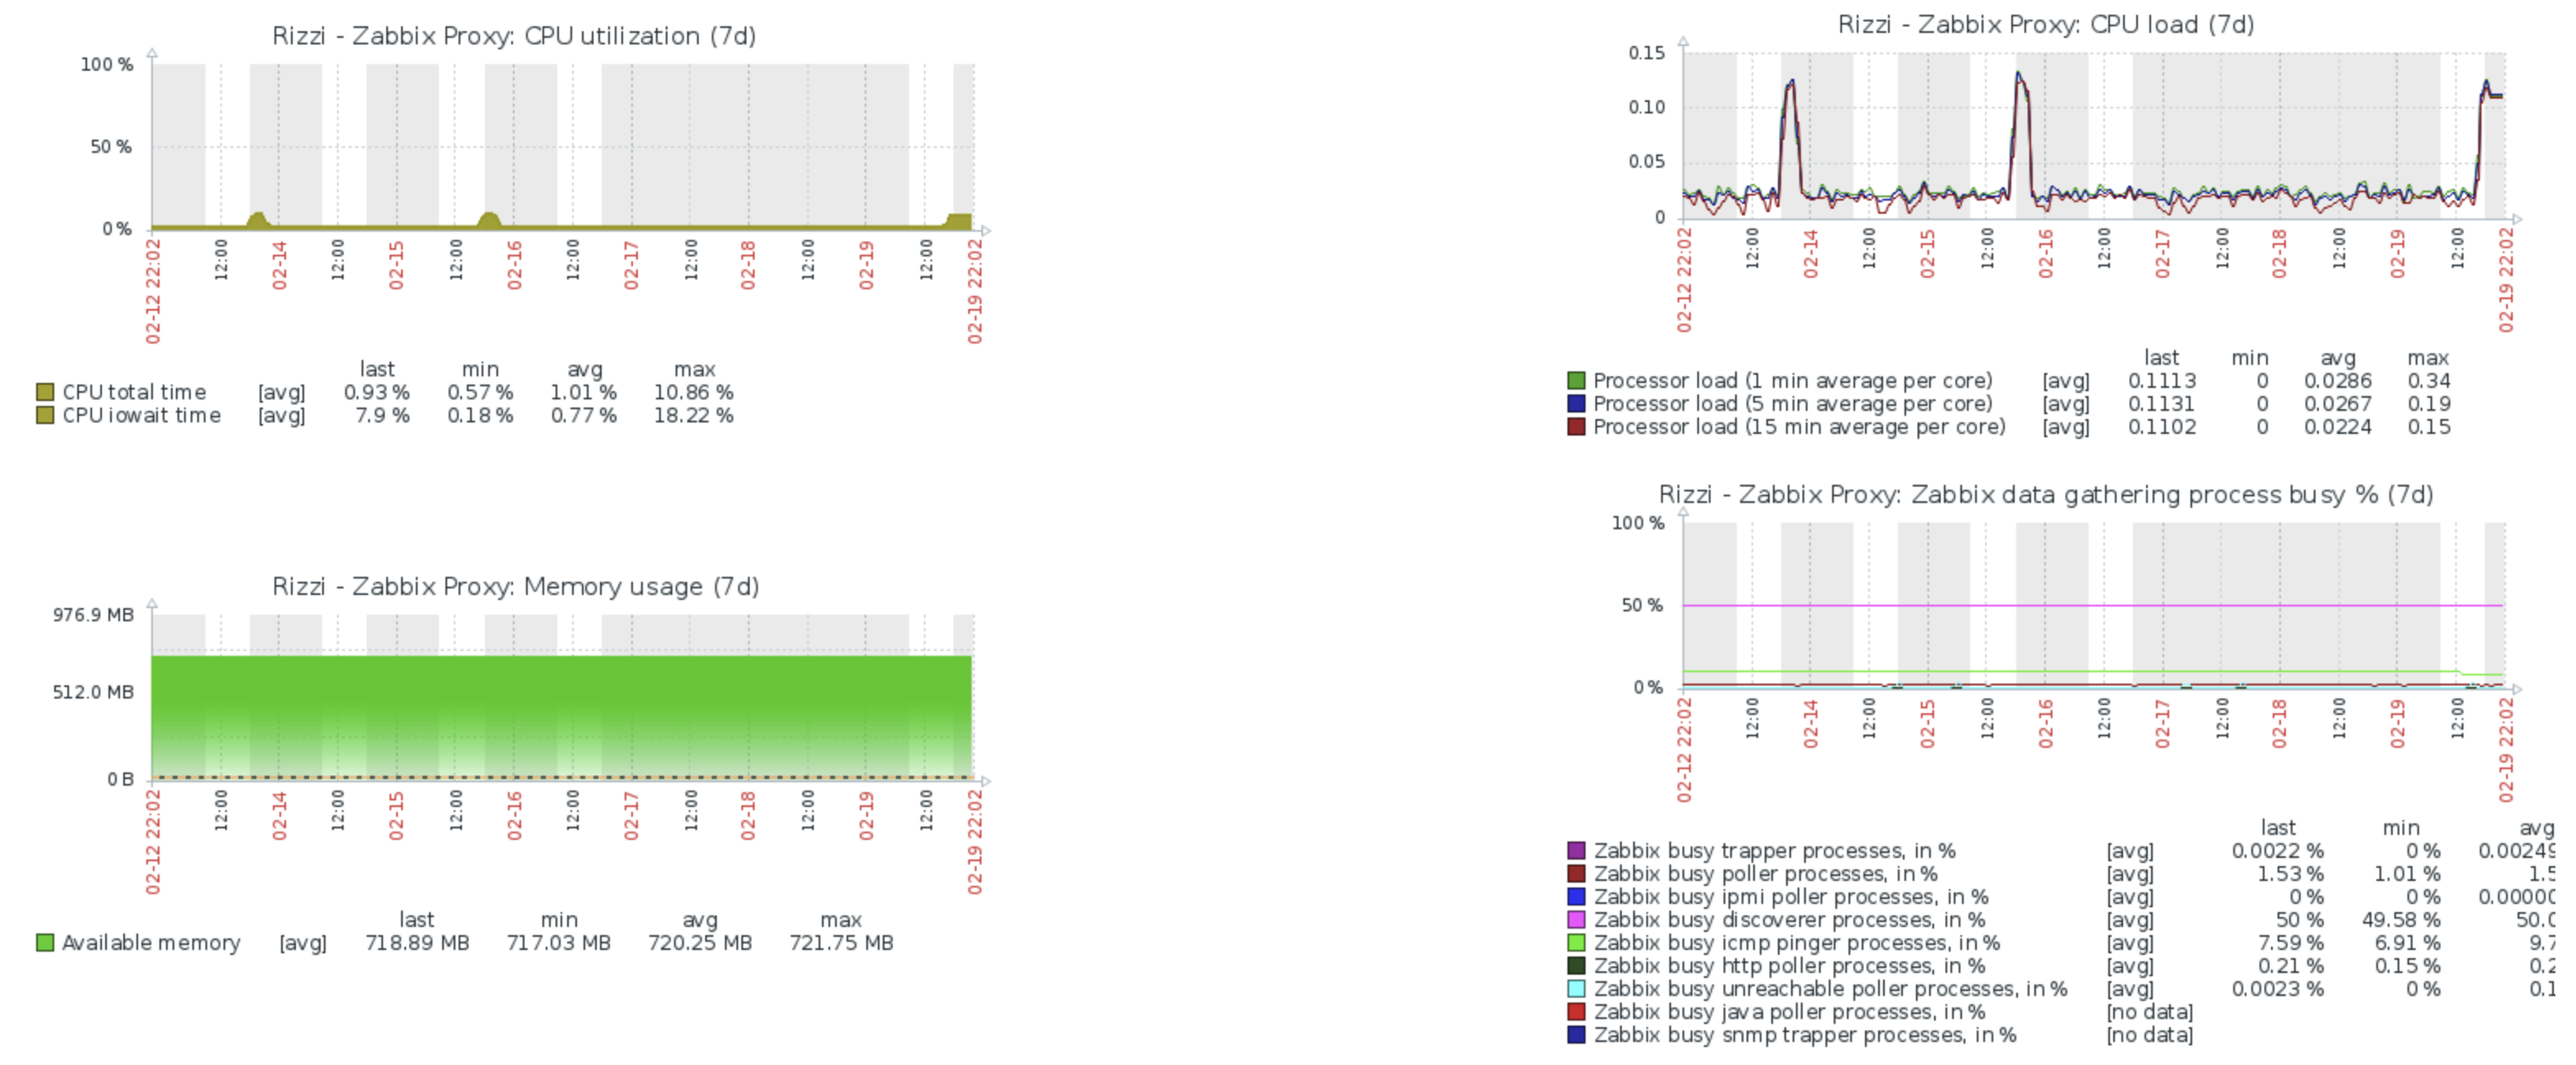
You may be accustomized to some kind of setup/hardware but I do think Zabbix is flexible enough to fit inside 1 GB RAM box (if you don’t use, for example, JMX checks for Java/Tomcat applications). As I have said, binaries are really optimized. Below some graphs for a Proxy on a Raspberry PI (1 week of data). This Raspberry PI collects data about 153 checks on 7 hosts.
In comparison to only Nagios this is absolutely true. I use to monitor networks with OMD which is able to manage any point you mentioned with Nagios or Icinga as core. This is not about Zabbix vs. Nagios, i just wanted to point out that Nagios fans still have the possibility to use their favourite monitoring inside NethServer with nice web UI.
I was using a simple distri called FAN. It worked for a while great, still does actually.
But being based on an OLD Kernel, and no more updates since 2+ years AND Repo shut down by centos / red hat I thought it’s time to move on.
That’s when, durng evaluation, I discovered Zabbix - and I’m sold on it!
Many Maps, Screens, and it all comes in one package.
Their Client List is also quite respecatable, I know of more huge companies who use it, but aren’t displayed on the customer list…
@Andy_Wismer, how do you import all the images? I managed to import them in postgresql:
Create following directory symbols_by_andy_wismer and put the images there, it has to be there to be correctly imported, at least I found no other way:
mkdir -p /var/lib/pgsql/data/symbols_by_andy_wismer
cd /var/lib/pgsql/data/symbols_by_andy_wismer
Then import the images:
for d in *; do su postgres -c "psql zabbix postgres -c \"insert into images (imageid,imagetype,name,image) values ((select max(imageid) +1 from images),1,'$d',pg_read_binary_file('symbols_by_andy_wismer/$d'));\""; done
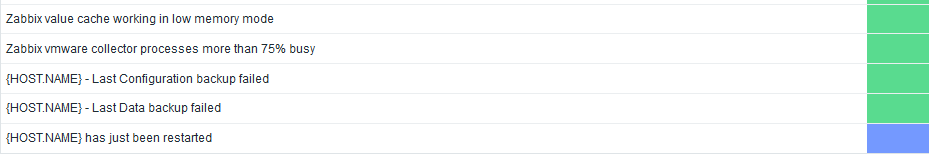
Backup monitoring script - thanks to @syntaxerrormmm
You just have to import the /root/zbx-nethbackup-check-master/nethbackup_check.xml file via web UI as described at the end of Emilianos readme
On the Zabbix Server, import the nethbackup_check.xml file inside the Configuration > Templates > Import function. Then assign the template NethServer backup check to any host on which you have installed the Zabbix Agent and the previous files.


 !
!